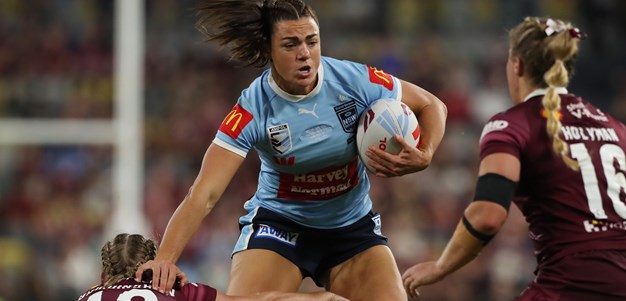
Millie Elliott
Prop
Player Bio
- Height:
- 181 cm
- Date of Birth:
- 19 May 1998
- Weight:
- 83 kg
- Birthplace:
- Cobargo, NSW
- Age:
- 26
- Nickname:
- Mills
- Debut Club:
- Brisbane Broncos Women
- Date:
- 15 September 2019
- Opposition:
- St. George Illawarra Dragons Women
- Round:
- 1
- Previous Clubs:
- Brisbane Broncos Women, Newcastle Knights Women
- Junior Club:
- Cobargo Eels
- Biography:
Millie Boyle will be determined to add to her glittering trophy cabinet in the Red, White and Blue, having captained the Newcastle Knights to their inaugural Premiership in 2022. The dual-code international is arguably the premier prop of the competition, and has been a consistent member of the NSW Sky Blues and Australian Jillaroos squads throughout her career.
Off the field, Boyle is the Director of Trainer Group, a disability service provider dedicated to educating and supporting participants to get active in the community.
Career
- Appearances
- 38
- Tries
- 7
2024 Season
- Appearances
- 10
Scoring
- Tries
- 0
Attack
- Tackle Breaks
- 22
- Average Hit Ups
- 13.8
- Post Contact Metres
- 644
Passing
- Offloads
- 4
Defence
- Tackles Made
- 318
- Tackle Efficiency
-
Running Metres
- Average Running Metres
- 158
- Total Running Metres
- 1584
Fantasy
- Total Points
- 488
- Average Points
- 48.8
2024 Season - By Round
Round | Opponent | Score | Position | Minutes Played | Tries | Goals | 1 Point Field Goals | 2 Point Field Goals | Points | Try Assists | Linebreaks | Tackle Breaks | Post Contact Metres | Offloads | Receipts | Tackles Made | Missed Tackles | Total Running Metres | Hit Up Running Metres | Kick Return Metres | |
---|---|---|---|---|---|---|---|---|---|---|---|---|---|---|---|---|---|---|---|---|---|
1 | Knights | Lost | 12 - 10 | Prop | 52 | - | - | - | - | - | - | - | 1 | 56 | - | 17 | 28 | 2 | 170 | 151 | 18 |
2 | Broncos | Won | 28 - 12 | Prop | 59 | - | - | - | - | - | - | 1 | 3 | 63 | - | 18 | 39 | 1 | 187 | 187 | - |
3 | Wests Tigers | Won | 20 - 4 | Prop | 47 | - | - | - | - | - | - | - | 2 | 85 | 1 | 19 | 28 | 3 | 202 | 188 | 14 |
4 | Dragons | Won | 8 - 28 | Prop | 50 | - | - | - | - | - | - | - | 1 | 70 | - | 14 | 27 | 4 | 137 | 129 | 7 |
5 | Titans | Lost | 26 - 6 | Prop | 44 | - | - | - | - | - | - | - | 2 | 46 | - | 9 | 36 | 3 | 98 | 98 | - |
6 | Raiders | Won | 34 - 20 | Prop | 51 | - | - | - | - | - | - | - | 1 | 53 | - | 11 | 29 | 3 | 101 | 101 | - |
8 | Cowboys | Won | 24 - 12 | Interchange | 53 | - | - | - | - | - | - | - | 6 | 80 | 1 | 18 | 39 | 3 | 176 | 176 | - |
9 | Eels | Won | 18 - 32 | Prop | 51 | - | - | - | - | - | - | - | 3 | 62 | 2 | 15 | 33 | - | 148 | 121 | 26 |
10 | Knights | Won | 25 - 16 | Prop | 53 | - | - | - | - | - | - | - | 1 | 61 | - | 17 | 35 | - | 166 | 128 | 37 |
11 | Sharks | Won | 32 - 28 | Prop | 50 | - | - | - | - | - | - | - | 2 | 67 | - | 20 | 24 | 3 | 196 | 127 | 68 |
Career By Season
Year | Played | Won | Lost | Drawn | Win % | Tries | Goals | 1 Point Field Goals | 2 Point Field Goals | Points | Tackle Breaks | Post Contact Metres | Offloads | Tackles Made | Missed Tackles | Tackle Efficiency | Total Running Metres | Average Running Metres | Kick Return Metres | Total Points | Average Points | |
---|---|---|---|---|---|---|---|---|---|---|---|---|---|---|---|---|---|---|---|---|---|---|
Broncos | 2019 | 4 | 3 | 1 | - | 75% | - | - | - | - | - | 4 | 163 | 1 | 76 | 4 | 95.00% | 390 | 97.00 | 54 | 110 | 27.5 |
Broncos | 2020 | 4 | 4 | - | - | 100% | 1 | - | - | - | 4 | 6 | 206 | 2 | 90 | 6 | 93.75% | 433 | 108.00 | 49 | 148 | 37.0 |
Broncos | 2021 | 5 | 4 | 1 | - | 80% | 3 | - | - | - | 12 | 14 | 379 | 2 | 116 | 9 | 92.80% | 993 | 198.00 | 164 | 265 | 53.0 |
Knights | 2022 | 7 | 6 | 1 | - | 86% | 1 | - | - | - | 4 | 25 | 603 | 4 | 190 | 11 | 94.53% | 1,395 | 199.00 | 145 | 376 | 53.7 |
Roosters | 2023 | 8 | 6 | 2 | - | 75% | 2 | - | - | - | 8 | 29 | 556 | 4 | 220 | 14 | 94.02% | 1,296 | 162.00 | 132 | 408 | 51.0 |
Roosters | 2024 | 10 | 8 | 2 | - | 80% | - | - | - | - | - | 22 | 644 | 4 | 318 | 22 | 93.53% | 1,584 | 158.00 | 172 | 488 | 48.8 |
Career Overall
Year Start | Year End | Played | Won | Lost | Drawn | Win % | Tries | Goals | 1 Point Field Goals | 2 Point Field Goals | Points | Tackle Breaks | Post Contact Metres | Offloads | Tackles Made | Missed Tackles | Tackle Efficiency | Total Running Metres | Average Running Metres | Kick Return Metres | Total Points | Average Points | |
---|---|---|---|---|---|---|---|---|---|---|---|---|---|---|---|---|---|---|---|---|---|---|---|
Broncos | 2019 | 2022 | 13 | 11 | 2 | - | 85% | 4 | - | - | - | 16 | 24 | 748 | 5 | 282 | 19 | 93.69% | 1,816 | 139.00 | 268 | 523 | 40.2 |
Knights | 2022 | 2022 | 7 | 6 | 1 | - | 86% | 1 | - | - | - | 4 | 25 | 603 | 4 | 190 | 11 | 94.53% | 1,395 | 199.00 | 145 | 376 | 53.7 |
Roosters | 2023 | 2024 | 18 | 14 | 4 | - | 78% | 2 | - | - | - | 8 | 51 | 1,200 | 8 | 538 | 36 | 93.73% | 2,881 | 160.00 | 305 | 896 | 49.8 |
Latest
Team Mates
National Rugby League respects and honours the Traditional Custodians of the land and pay our respects to their Elders past, present and future. We acknowledge the stories, traditions and living cultures of Aboriginal and Torres Strait Islander peoples on the lands we meet, gather and play on.