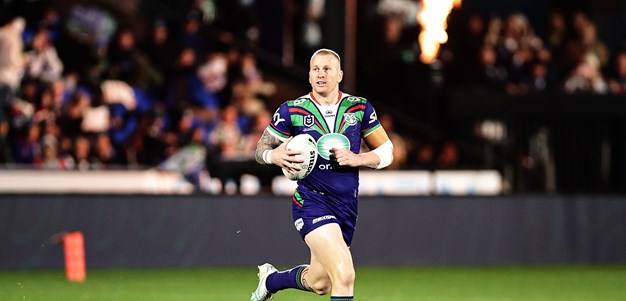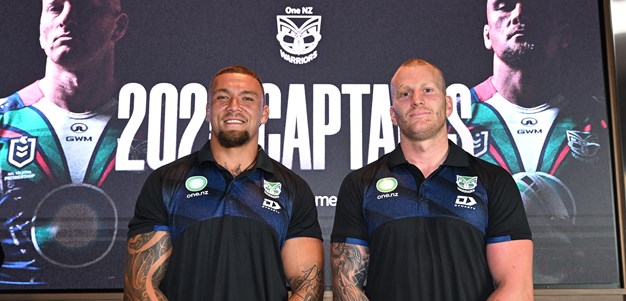

Mitchell Barnett
Captain - Lock
Player Bio
- Height:
- 187 cm
- Date of Birth:
- 15 April 1994
- Weight:
- 104 kg
- Birthplace:
- Taree, NSW
- Age:
- 31
- Nickname:
- Barny
- Debut Club:
- Canberra Raiders
- Date:
- 10 August 2015
- Opposition:
- Wests Tigers
- Round:
- 22
- Previous Clubs:
- Canberra Raiders, Newcastle Knights
- Junior Club:
- Wingham Tigers
- Biography:
No-nonsense forward signed from Newcastle on a three-year contract to the end of the 2025 season.
Barnett joined fellow second rower Marata Niukore (Parramatta), utility Dylan Walker (Manly Warringah) and halfback Luke Metcalf (Cronulla Sutherland) as the club’s first four major acquisitions for the 2023 season.
He spent seven seasons with the Knights making a total of 126 appearances after debuting for the club in a loss to the One New Zealand Warriors in 2016. Across his Newcastle career he averaged 105 metres and 33 tackles a game.
Barnett initially played for the Knights in the lower grades before joining Canberra in 2013 where he played for the club’s under-20 side before making his NRL debut late in the 2015 season.
Predominantly playing for the Raiders’ feeder club the Mount Pritchard Mounties, he was named the New South Wales Cup player of the year in 2015.
Career By Season
| Year | Played | Won | Lost | Drawn | Win % | Tries | Goals | 1 Point Field Goals | 2 Point Field Goals | Points | Kicking Metres | Kicking Metres Average | Goal Conversion Rate | Forced Drop Outs | Tackle Breaks | Post Contact Metres | Offloads | Tackles Made | Missed Tackles | Tackle Efficiency | Total Running Metres | Average Running Metres | Kick Return Metres | Total Points | Average Points | |
|---|---|---|---|---|---|---|---|---|---|---|---|---|---|---|---|---|---|---|---|---|---|---|---|---|---|---|
| Raiders | 2015 | 2 | - | 2 | - | - | - | - | - | - | - | - | - | - | - | 5 | 83 | 1 | 40 | 3 | 93.02% | 163 | 81.00 | - | 64 | 32.0 |
| Knights | 2016 | 9 | - | 9 | - | - | 2 | - | - | - | 8 | 124 | 13.81 | - | 1 | 28 | 348 | 15 | 290 | 28 | 87.68% | 1,131 | 125.00 | - | 449 | 49.9 |
| Knights | 2017 | 22 | 4 | 18 | - | 18% | 4 | - | - | - | 16 | 193 | 8.75 | - | 1 | 31 | 603 | 28 | 763 | 58 | 92.94% | 1,935 | 87.00 | 59 | 972 | 44.2 |
| Knights | 2018 | 23 | 9 | 14 | - | 39% | 2 | - | - | - | 8 | 123 | 5.33 | - | 1 | 25 | 857 | 24 | 681 | 74 | 90.20% | 2,224 | 96.00 | 20 | 841 | 36.6 |
| Knights | 2019 | 21 | 9 | 12 | - | 43% | 7 | 3 | - | - | 34 | 13 | 0.61 | 100.00% | - | 22 | 576 | 19 | 736 | 77 | 90.53% | 1,719 | 81.00 | 8 | 905 | 43.1 |
| Knights | 2020 | 13 | 8 | 5 | - | 62% | 1 | - | - | - | 4 | 16 | 1.19 | - | - | 22 | 646 | 24 | 473 | 40 | 92.20% | 1,520 | 116.00 | - | 641 | 49.3 |
| Knights | 2021 | 24 | 12 | 12 | - | 50% | 4 | 13 | - | - | 42 | 99 | 4.11 | 81.25% | 1 | 44 | 1,222 | 27 | 813 | 62 | 92.91% | 3,144 | 131.00 | 22 | 1,295 | 54.0 |
| Knights | 2022 | 14 | 6 | 8 | - | 43% | 1 | - | - | - | 4 | - | - | - | - | 16 | 666 | 14 | 454 | 35 | 92.84% | 1,607 | 114.00 | 10 | 605 | 43.2 |
| Warriors | 2023 | 15 | 10 | 5 | - | 67% | 2 | - | - | - | 8 | - | - | - | - | 25 | 722 | 8 | 455 | 43 | 91.37% | 2,029 | 135.00 | 96 | 671 | 44.7 |
| Warriors | 2024 | 23 | 9 | 13 | 1 | 39% | 4 | - | - | - | 16 | 72 | 3.13 | - | - | 46 | 1,409 | 28 | 727 | 47 | 93.93% | 3,441 | 149.00 | 221 | 1,226 | 53.3 |
| Warriors | 2025 | 11 | 9 | 2 | - | 82% | - | - | - | - | - | 29 | 2.60 | - | - | 15 | 578 | 2 | 376 | 19 | 95.19% | 1,451 | 131.00 | 176 | 508 | 46.2 |
Latest
Team Mates

National Rugby League respects and honours the Traditional Custodians of the land and pay our respects to their Elders past, present and future. We acknowledge the stories, traditions and living cultures of Aboriginal and Torres Strait Islander peoples on the lands we meet, gather and play on.


