You have skipped the navigation, tab for page content
Cameron Smith Profile Image

Cameron Smith

Hooker

Retired

Player Bio

Date of Birth:
18 June 1983
Birthplace:
Brisbane, QLD
Nickname:
Smitty
Debut Club:
Melbourne Storm
Date:
13 April 2002
Opposition:
Canterbury-Bankstown Bulldogs
Round:
5
Previous Club:
Melbourne Storm
Junior Club:
Logan Brothers
Biography:

Unparalleled in terms of sheer achievement and longevity, Cameron Smith is regarded as one of the greatest players of all time and an Immortal-in-waiting.

The only man to have played 400 premiership games, Smith was a winner like no other with unmatched smarts and composure at dummy-half.

A tremendous leader, for years he captained Melbourne, Queensland and Australia to glory, filling cabinet after cabinet with silverware.

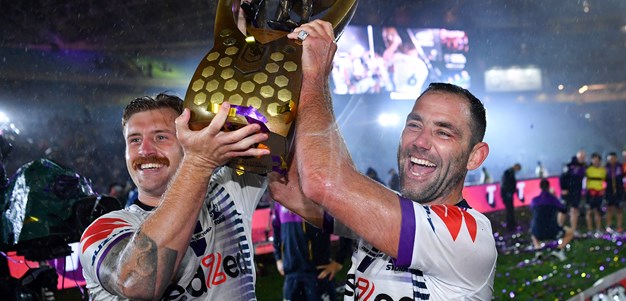
The two-time Dally M Medallist remained at the peak of his powers even at age 37 as he led the Storm to the 2020 premiership in his 19th top-grade season.

It was a fitting note on which to retire.

Among the left-footed goal-kicker's smorgasbord of records is his claim to being the NRL's top point-scorer (2786 points).

Career

Career Milestones

  • NRL record holder for most career games (430)
  • NRL record holder for most career points (2786)
  • 56 Tests Australia (2006-17)
  • World Cup (2008, 2013, 2017)
  • Four Nations (2009-11, 2014, 2016)
  • 42 games Queensland (2003-17)
  • Golden Boot Award: 2007, 2017
  • Dally M Player Of The Year: 2006, 2017
  • Dally M Hooker Of The Year: 2006, 2008, 2011, 2012, 2013, 2016, 2017, 2019, 2020
  • Dally M Captain Of The Year: 2011, 2013, 2017, 2018, 2019
  • Dally M Representative Player Of The Year : 2007, 2011, 2013, 2016
  • Wally Lewis Medal: 2007, 2011, 2013, 2016
  • Ron McAuliffe Medal : 2005, 2007, 2013, 2015
  • RLIF Hooker Of The Year : 2008, 2009, 2011, 2012
  • RFIL Player Of The Year: 2012
  • Harry Sunderland Medal: 2014
  • Premierships 2012, 2017, 2020

Playing

Appearances
430
Points
2786
Tries
48

Career By Season

Career By Season
Year Played Won Lost Drawn Win % Tries Goals 1 Point Field Goals 2 Point Field Goals Points Kicking Metres Kicking Metres Average Goal Conversion Rate Forced Drop Outs Try Assists Offloads Receipts Tackles Made Missed Tackles Tackle Efficiency Total Running Metres Average Running Metres Kick Return Metres Total Points Average Points
Storm 2002 2 1 1 - 50% - - - - - - - - - - 1 - 38 2 96.90% 51 25.00 - - -
Storm 2003 24 15 9 - 62% 4 8 - - 32 3,932 163.83 88.89% - 4 4 - 821 30 92.34% 1,326 55.00 3 - -
Storm 2004 23 12 11 - 52% 4 43 - - 102 3,646 158.52 68.25% - 6 7 - 815 47 88.63% 1,297 56.00 16 - -
Storm 2005 23 13 10 - 57% 3 30 - - 72 3,558 154.70 68.18% - 5 7 - 899 42 91.83% 1,630 70.00 32 - -
Storm 2006 25 21 4 - 84% 5 79 - - 178 5,416 216.64 71.17% - 8 8 - 916 40 91.27% 1,547 61.00 71 - -
Storm 2007 24 21 3 - 88% 4 88 - - 192 4,449 185.38 70.97% - 8 7 - 855 45 91.28% 1,544 64.00 39 - -
Storm 2008 23 18 5 - 78% 4 77 - - 170 4,187 182.04 69.37% - 10 5 - 916 34 92.95% 1,537 66.00 1 - -
Storm 2009 25 16 8 1 64% 3 65 - - 142 4,327 173.08 72.22% - 10 14 - 990 43 90.42% 1,533 61.00 41 - -
Storm 2010 20 12 8 - 60% 2 54 - - 116 3,539 176.95 75.00% - 5 15 - 773 47 89.32% 1,040 52.00 - - -
Storm 2011 24 19 5 - 79% 2 78 - - 164 4,144 172.67 83.87% - 9 24 - 1,001 50 91.11% 1,525 63.00 5 - -
Storm 2012 25 20 5 - 80% 2 78 - - 164 3,634 145.38 69.03% 1 11 28 116 997 45 95.68% 1,772 70.00 10 - -
Storm 2013 23 16 6 1 70% 2 84 - - 176 3,654 158.89 74.34% 8 11 24 2,376 1,012 33 93.76% 1,582 68.00 11 1,671 72.6
Storm 2014 23 13 10 - 57% 2 68 - - 145 3,515 152.82 70.83% 7 6 20 2,301 963 33 93.44% 983 42.00 1 1,433 62.3
Storm 2015 25 15 10 - 60% 1 71 - - 146 3,081 123.22 78.89% 11 11 21 2,625 1,125 37 96.82% 1,188 47.00 - 1,556 62.2
Storm 2016 26 21 5 - 81% 2 92 - - 194 3,863 148.59 75.41% 12 18 19 2,923 1,112 50 92.65% 1,381 53.00 1 1,730 66.5
Storm 2017 23 21 2 - 91% 2 92 - - 192 3,898 169.50 79.31% 7 13 13 2,260 890 49 94.78% 1,267 55.00 19 1,465 63.7
Storm 2018 26 18 8 - 69% 1 98 - - 201 3,780 145.37 82.35% 4 4 19 2,637 1,054 42 96.17% 959 36.00 - 1,531 58.9
Storm 2019 27 21 6 - 78% 2 104 - - 216 3,194 118.29 79.39% 20 15 11 3,120 1,060 39 96.45% 1,324 49.00 2 1,647 61.0
Storm 2020 19 17 2 - 89% 3 86 - - 184 2,329 122.56 84.31% 8 15 11 2,214 678 26 96.31% 802 42.00 14 1,166 61.4

Career Overall

Career Overall
Year Start Year End Played Won Lost Drawn Win % Tries Goals 1 Point Field Goals 2 Point Field Goals Points Kicking Metres Kicking Metres Average Goal Conversion Rate Forced Drop Outs Try Assists Offloads Receipts Tackles Made Missed Tackles Tackle Efficiency Total Running Metres Average Running Metres Kick Return Metres Total Points Average Points
Storm 2002 2020 430 310 118 2 72% 48 1,295 - - 2,786 68,149 158.49 75.29% 79 169 257 20,859 16,914 734 95.84% 24,136 56.00 268 12,186 63.5

Latest

Acknowledgement of Country

National Rugby League respects and honours the Traditional Custodians of the land and pay our respects to their Elders past, present and future. We acknowledge the stories, traditions and living cultures of Aboriginal and Torres Strait Islander peoples on the lands we meet, gather and play on.


Premier Partner

Media Partners

Major Partners

View All Partners