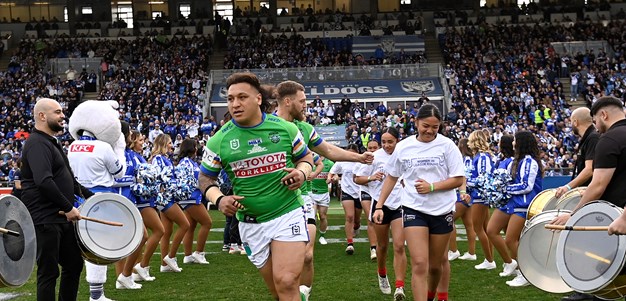
You have skipped the navigation, tab for page content
Josh Papalii
Prop
Player Bio
- Height:
- 182 cm
- Date of Birth:
- 13 May 1992
- Weight:
- 117 kg
- Birthplace:
- Auckland, NZ
- Age:
- 32
- Nickname:
- -
- Debut Club:
- Canberra Raiders
- Date:
- 14 May 2011
- Opposition:
- Melbourne Storm
- Round:
- 10
- Previous Club:
- -
- Junior Club:
- Logan Brothers
- Biography:
Josh Papalii continues to defy time as the veteran forward had yet another terrific season for the Green Machine.
Papalii became only the third Raider to reach 300 NRL games, joining Jarrod and Jason Croker, after reaching his milestone against the Bulldogs at Belmore in round 22.
At age 32, Papalii played 23 games, scoring 2 tries, averaging 106 running metres per game with an astounding 98% tackle efficiency.
Career
- Appearances
- 305
- Tries
- 64
2024 Season
- Appearances
- 23
Scoring
- Tries
- 2
Attack
- Tackle Breaks
- 37
- Average Hit Ups
- 8.7
- Post Contact Metres
- 960.5
Passing
- Offloads
- 12
Defence
- Tackles Made
- 515
- Tackle Efficiency
-
Running Metres
- Average Running Metres
- 106
- Total Running Metres
- 2447
Fantasy
- Total Points
- 863
- Average Points
- 37.5
2024 Season - By Round
Round | Opponent | Score | Position | Minutes Played | Tries | Goals | 1 Point Field Goals | 2 Point Field Goals | Points | Try Assists | Linebreaks | Tackle Breaks | Post Contact Metres | Offloads | Receipts | Tackles Made | Missed Tackles | Total Running Metres | Hit Up Running Metres | Kick Return Metres | |
---|---|---|---|---|---|---|---|---|---|---|---|---|---|---|---|---|---|---|---|---|---|
1 | Knights | Won | 12 - 28 | Prop | 38 | - | - | - | - | - | - | - | 2 | 42 | 2 | 12 | 24 | - | 115 | 105 | 9 |
2 | Wests Tigers | Won | 32 - 12 | Prop | 45 | - | - | - | - | - | - | - | 4 | 64 | - | 15 | 14 | - | 139 | 86 | 52 |
3 | Warriors | Lost | 18 - 10 | Prop | 39 | - | - | - | - | - | - | - | 1 | 34 | - | 8 | 27 | - | 65 | 65 | - |
4 | Sharks | Lost | 36 - 22 | Prop | 41 | - | - | - | - | - | - | - | 1 | 37 | - | 14 | 22 | - | 102 | 48 | 53 |
5 | Eels | Won | 41 - 8 | Prop | 30 | - | - | - | - | - | - | - | - | 39 | 1 | 12 | 17 | - | 90 | 67 | 22 |
6 | Titans | Won | 21 - 20 | Prop | 49 | - | - | - | - | - | - | - | 5 | 67 | 1 | 16 | 17 | - | 139 | 111 | 27 |
7 | Broncos | Lost | 34 - 10 | Prop | 46 | - | - | - | - | - | 1 | - | 2 | 42 | 1 | 12 | 24 | - | 102 | 75 | 26 |
8 | Sharks | Lost | 0 - 40 | Prop | 45 | - | - | - | - | - | - | - | 1 | 19 | 1 | 10 | 24 | 5 | 73 | 61 | 11 |
9 | Sea Eagles | Won | 24 - 26 | Interchange | 43 | - | - | - | - | - | - | - | - | 30 | - | 16 | 16 | - | 85 | 74 | 11 |
11 | Bulldogs | Won | 24 - 20 | Interchange | 35 | - | - | - | - | - | - | - | 2 | 45 | 1 | 9 | 24 | 1 | 105 | 80 | 24 |
13 | Dolphins | Won | 25 - 26 | Interchange | 45 | - | - | - | - | - | - | - | - | 76 | - | 17 | 25 | - | 180 | 154 | 26 |
15 | Cowboys | Lost | 16 - 34 | Interchange | 48 | - | - | - | - | - | - | - | 1 | 36 | 3 | 12 | 26 | - | 92 | 92 | - |
16 | Wests Tigers | Lost | 48 - 24 | Prop | 46 | - | - | - | - | - | - | 1 | 2 | 40 | - | 14 | 21 | 1 | 113 | 72 | 32 |
17 | Storm | Lost | 16 - 6 | Prop | 41 | - | - | - | - | - | - | - | 1 | 49 | 1 | 12 | 31 | 1 | 97 | 97 | - |
18 | Knights | Lost | 12 - 16 | Prop | 44 | 1 | - | - | - | 4 | - | 1 | 2 | 64 | - | 16 | 26 | 1 | 154 | 108 | 39 |
20 | Warriors | Won | 20 - 18 | Prop | 48 | - | - | - | - | - | - | - | 2 | 39 | - | 15 | 27 | - | 132 | 80 | 47 |
21 | Rabbitohs | Won | 32 - 12 | Prop | 31 | - | - | - | - | - | - | - | 1 | 40 | - | 10 | 18 | - | 99 | 66 | 32 |
22 | Bulldogs | Lost | 22 - 18 | Prop | 50 | - | - | - | - | - | - | - | 2 | 47 | 1 | 16 | 33 | 1 | 131 | 112 | 18 |
23 | Sea Eagles | Lost | 24 - 46 | Prop | 54 | 1 | - | - | - | 4 | - | 1 | 5 | 36 | - | 15 | 22 | - | 96 | 80 | 16 |
24 | Cowboys | Lost | 42 - 4 | Interchange | 34 | - | - | - | - | - | - | - | 1 | 20 | - | 6 | 21 | - | 57 | 57 | - |
25 | Panthers | Won | 22 - 18 | Interchange | 36 | - | - | - | - | - | - | - | 2 | 22 | - | 6 | 21 | - | 68 | 27 | 41 |
26 | Roosters | Won | 12 - 14 | Interchange | 24 | - | - | - | - | - | - | - | - | 27 | - | 8 | 10 | - | 75 | 59 | 15 |
27 | Dragons | Won | 24 - 26 | Interchange | 39 | - | - | - | - | - | - | - | - | 44 | - | 12 | 25 | - | 127 | 81 | 46 |
Career By Season
Year | Played | Won | Lost | Drawn | Win % | Tries | Goals | 1 Point Field Goals | 2 Point Field Goals | Points | Kicking Metres | Kicking Metres Average | Forced Drop Outs | Tackle Breaks | Post Contact Metres | Offloads | Tackles Made | Missed Tackles | Tackle Efficiency | Total Running Metres | Average Running Metres | Kick Return Metres | Total Points | Average Points | |
---|---|---|---|---|---|---|---|---|---|---|---|---|---|---|---|---|---|---|---|---|---|---|---|---|---|
Raiders | 2011 | 14 | 5 | 9 | - | 36% | 3 | - | - | - | 12 | - | - | - | 43 | - | 5 | 326 | 30 | 88.84% | 974 | 69.00 | - | - | - |
Raiders | 2012 | 26 | 14 | 12 | - | 54% | 7 | - | - | - | 28 | 27 | 1.04 | - | 48 | - | 21 | 690 | 66 | 91.27% | 2,277 | 87.00 | - | - | - |
Raiders | 2013 | 21 | 9 | 12 | - | 43% | 3 | - | - | - | 12 | 60 | 2.87 | - | 63 | 984 | 11 | 612 | 30 | 92.42% | 2,425 | 115.00 | 24 | 1,037 | 49.4 |
Raiders | 2014 | 19 | 6 | 13 | - | 32% | 3 | - | - | - | 12 | 76 | 4.01 | - | 54 | 858 | 17 | 510 | 27 | 92.13% | 1,871 | 98.00 | 11 | 751 | 39.5 |
Raiders | 2015 | 24 | 10 | 14 | - | 42% | 8 | - | - | - | 32 | 43 | 1.79 | - | 43 | 1,048 | 20 | 689 | 42 | 94.25% | 2,356 | 98.00 | 105 | 1,081 | 45.0 |
Raiders | 2016 | 25 | 16 | 8 | 1 | 64% | 7 | - | - | - | 28 | 10 | 0.41 | 1 | 59 | 1,156 | 31 | 568 | 38 | 88.60% | 3,046 | 121.00 | 31 | 1,118 | 44.7 |
Raiders | 2017 | 20 | 9 | 11 | - | 45% | 5 | - | - | - | 20 | - | - | - | 60 | 1,078 | 28 | 481 | 32 | 93.76% | 2,775 | 138.00 | 27 | 984 | 49.2 |
Raiders | 2018 | 22 | 8 | 14 | - | 36% | 5 | - | - | - | 20 | - | - | - | 60 | 1,217 | 14 | 640 | 45 | 93.43% | 2,846 | 129.00 | 131 | 1,076 | 48.9 |
Raiders | 2019 | 26 | 16 | 10 | - | 62% | 6 | - | - | - | 24 | - | - | - | 61 | 1,374 | 31 | 736 | 31 | 95.96% | 3,830 | 147.00 | 521 | 1,354 | 52.1 |
Raiders | 2020 | 22 | 15 | 7 | - | 68% | 5 | - | - | - | 20 | - | - | - | 44 | 1,208 | 24 | 675 | 13 | 98.11% | 3,270 | 148.00 | 510 | 1,196 | 54.4 |
Raiders | 2021 | 20 | 9 | 11 | - | 45% | 4 | - | - | - | 16 | 14 | 0.70 | 1 | 48 | 988 | 30 | 547 | 21 | 96.30% | 2,627 | 131.00 | 276 | 993 | 49.6 |
Raiders | 2022 | 25 | 14 | 11 | - | 56% | 4 | - | - | - | 16 | - | - | - | 81 | 1,210 | 39 | 643 | 23 | 96.55% | 3,113 | 124.00 | 512 | 1,252 | 50.1 |
Raiders | 2023 | 18 | 10 | 8 | - | 56% | 2 | - | - | - | 8 | - | - | - | 39 | 899 | 11 | 424 | 20 | 95.50% | 2,330 | 129.00 | 467 | 757 | 42.1 |
Raiders | 2024 | 23 | 12 | 11 | - | 52% | 2 | - | - | - | 8 | - | - | - | 37 | 960 | 12 | 515 | 10 | 98.10% | 2,447 | 106.00 | 560 | 863 | 37.5 |
Career Overall
Year Start | Year End | Played | Won | Lost | Drawn | Win % | Tries | Goals | 1 Point Field Goals | 2 Point Field Goals | Points | Kicking Metres | Kicking Metres Average | Forced Drop Outs | Tackle Breaks | Post Contact Metres | Offloads | Tackles Made | Missed Tackles | Tackle Efficiency | Total Running Metres | Average Running Metres | Kick Return Metres | Total Points | Average Points | |
---|---|---|---|---|---|---|---|---|---|---|---|---|---|---|---|---|---|---|---|---|---|---|---|---|---|---|
Raiders | 2011 | 2024 | 305 | 153 | 151 | 1 | 50% | 64 | - | - | - | 256 | 231 | 0.76 | 2 | 740 | 12,972 | 294 | 8,051 | 428 | 94.95% | 36,166 | 118.00 | 3,166 | 12,450 | 47.0 |
Latest
Team Mates
National Rugby League respects and honours the Traditional Custodians of the land and pay our respects to their Elders past, present and future. We acknowledge the stories, traditions and living cultures of Aboriginal and Torres Strait Islander peoples on the lands we meet, gather and play on.