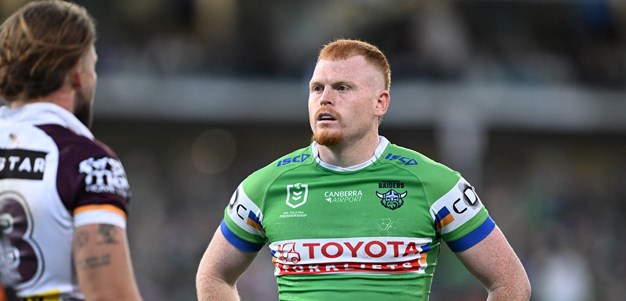

Corey Horsburgh
Prop
Player Bio
- Height:
- 188 cm
- Date of Birth:
- 05 January 1998
- Weight:
- 107 kg
- Birthplace:
- Caboolture, QLD
- Age:
- 28
- Nickname:
- -
- Debut Club:
- Canberra Raiders
- Date:
- 17 March 2019
- Opposition:
- Gold Coast Titans
- Round:
- 1
- Previous Club:
- Canterbury-Bankstown Bulldogs
- Junior Club:
- Redcliffe Dolphins
- Biography:
Raider #357
Proven first grader Corey Horsburgh has evolved into a real leader at the Green Machine as he manages to reach new heights with each season in first grade.
The Queensland Origin representative enjoyed a strong 2025 campaign, earning the Raiders Coaches’ Award at the Meninga Medal and earning his first captaincy at the club when he led out the side against the Dolphins in Round 27.
His efforts in 2025 also earned the forward a call-up into the Australian PM’s XIII squad to take on PNG in Port Moresby.
With over 100 first grade matches now under his belt, Horsburgh has become a key component to a strong Raiders pack.
‘Red’ is currently locked in with the club until the end of the 2027 season.
Career By Season
| Year | Played | Won | Lost | Drawn | Win % | Tries | Goals | 1 Point Field Goals | 2 Point Field Goals | Points | Kicking Metres | Kicking Metres Average | Forced Drop Outs | Tackle Breaks | Post Contact Metres | Offloads | Tackles Made | Missed Tackles | Tackle Efficiency | Total Running Metres | Average Running Metres | Kick Return Metres | Total Points | Average Points | |
|---|---|---|---|---|---|---|---|---|---|---|---|---|---|---|---|---|---|---|---|---|---|---|---|---|---|
| Raiders | 2019 | 22 | 13 | 9 | - | 59% | - | - | - | - | - | - | - | - | 9 | 821 | 26 | 512 | 26 | 95.17% | 2,190 | 99.00 | 276 | 709 | 32.2 |
| Raiders | 2020 | 6 | 3 | 3 | - | 50% | - | - | - | - | - | - | - | - | 6 | 240 | 12 | 218 | 13 | 94.37% | 635 | 105.00 | - | 288 | 48.0 |
| Raiders | 2021 | 8 | 2 | 6 | - | 25% | 1 | - | - | - | 4 | - | - | - | 8 | 278 | 10 | 219 | 17 | 92.80% | 735 | 91.00 | 146 | 303 | 37.9 |
| Bulldogs | 2021 | 2 | - | 2 | - | - | - | - | - | - | - | - | - | - | 1 | 93 | 5 | 48 | 2 | 96.00% | 201 | 100.00 | 15 | 74 | 37.0 |
| Raiders | 2022 | 22 | 12 | 10 | - | 55% | 1 | - | - | - | 4 | 7 | 0.33 | - | 35 | 807 | 30 | 604 | 33 | 94.82% | 2,322 | 105.00 | 351 | 923 | 42.0 |
| Raiders | 2023 | 22 | 12 | 10 | - | 55% | 3 | - | - | - | 12 | 30 | 1.37 | - | 35 | 873 | 27 | 855 | 40 | 95.53% | 2,494 | 113.00 | 49 | 1,218 | 55.4 |
| Raiders | 2024 | 5 | 4 | 1 | - | 80% | 1 | - | - | - | 4 | 3 | 0.62 | - | 3 | 151 | 5 | 150 | 2 | 98.68% | 391 | 78.00 | 65 | 203 | 40.6 |
| Raiders | 2025 | 25 | 19 | 6 | - | 76% | 2 | - | - | - | 8 | 50 | 2.00 | 2 | 48 | 1,292 | 35 | 855 | 39 | 95.64% | 3,314 | 132.00 | 204 | 1,342 | 53.7 |
Latest
Team Mates

National Rugby League respects and honours the Traditional Custodians of the land and pay our respects to their Elders past, present and future. We acknowledge the stories, traditions and living cultures of Aboriginal and Torres Strait Islander peoples on the lands we meet, gather and play on.


