You have skipped the navigation, tab for page content
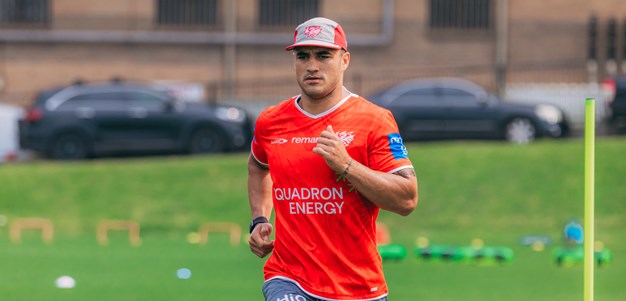
Valentine Holmes Profile Image

Valentine Holmes

Centre

Dragons

Player Bio

Height:
185 cm
Date of Birth:
24 July 1995
Weight:
90 kg
Birthplace:
Townsville, QLD
Age:
29
Nickname:
Val
Debut Club:
Cronulla-Sutherland Sharks
Date:
02 August 2014
Opposition:
Parramatta Eels
Round:
21
Previous Clubs:
Cronulla-Sutherland Sharks, North Queensland Cowboys
Junior Club:
Western Lions
Biography:

Holmes joins the club on a three-year deal having spent the past five seasons in Townsville.

The 29-year-old has represented the Kangaroos on 21 occasions scoring 20 tries – including a six-try haul against Fiji in their 2017 Rugby League World Cup semi-final clash – and the Maroons 19 times scoring 13 tries – the third-highest tally in the state’s history.

Holmes played in the Kangaroos’ 2017 and 2021 World Cup Final wins and has been a part of four State of Origin series wins.

Having played his juniors with the Western Lions in Townsville, Holmes made his way to the Sharks in 2013 and would go on to represent the Maroons in Under 18s and Under 20s Origin as well as the Junior Kangaroos.

He made his NRL debut for the Sharks as a 19-year-old in Round 21, 2014 and would go on to spend five seasons with the club before making the decision to pursue a career in American Football.

In April of 2019, he inked a deal with the New York Jets courtesy of the NFL's International Player Pathway program and appeared in a trio of preseason games.

He made his way back to the NRL with the Cowboys in 2020 and was named to the NRL’s Dally M Team of the Year two years later.

Holmes has led the NRL in point-scoring in two of the past three seasons and is currently ranked 38th on the premiership’s all-time point-scoring list with 1,240.

With 203 NRL matches and 108 tries to his name, Holmes is contracted to the Red V until at least the end of the 2027 season.

Career

Appearances
203
Tries
108

2024 Season

Appearances
24

Scoring

Tries
16
Goals
101

Kicking

Goal Conversion Rate

Attack

Try Assists
10
Line Breaks
18
Tackle Breaks
92

Passing

Receipts
489

Defence

Tackles Made
230
Missed Tackles
55
Tackle Efficiency

Running Metres

Average Running Metres
152
Total Running Metres
3657

Fantasy

Total Points
1175
Average Points
49

2024 Season - By Round

Round Opponent Score Position Minutes Played Tries Goals 1 Point Field Goals 2 Point Field Goals Points Kicking Metres Forced Drop Outs Try Assists Linebreaks Tackle Breaks Post Contact Metres Offloads Receipts Tackles Made Missed Tackles Total Running Metres Hit Up Running Metres Kick Return Metres
1 Dolphins Won 18 - 43 Centre 80 - 7 - - 14 - - 1 - 4 73 3 22 11 1 180 37 -
2 Knights Won 21 - 20 Centre 82 - 2 - - 4 12 - 1 - 3 52 1 21 15 2 123 - -
3 Dragons Won 24 - 46 Centre 80 1 7 - - 18 - - 1 2 7 108 1 20 13 2 247 11 -
4 Broncos Lost 38 - 12 Centre 80 1 2 - - 8 15 1 - - 4 37 2 20 10 2 114 - -
5 Titans Won 35 - 22 Centre 80 - 5 - - 10 35 - 1 1 4 54 2 26 10 2 216 18 14
6 Eels Lost 27 - 20 Centre 80 1 2 - - 8 - - - 2 4 27 1 16 6 1 104 - 2
7 Sharks Lost 42 - 6 Centre 80 1 1 - - 6 - - - - 2 30 - 19 15 2 111 - -
8 Panthers Lost 20 - 26 Centre 80 1 2 - - 8 - - - 1 6 41 2 21 5 2 147 - -
9 Dolphins Lost 26 - 28 Centre 80 - 3 - - 6 - - - 1 4 60 - 17 7 5 191 - -
10 Titans Lost 20 - 18 Centre 80 - 2 - - 4 - - - 1 3 77 - 28 11 - 201 - -
11 Rabbitohs Won 22 - 28 Centre 80 - 4 - - 8 33 - - - 4 49 1 22 14 4 117 14 -
12 Wests Tigers Won 42 - 28 Centre 70 2 7 - - 22 - - - 4 6 56 - 18 7 - 220 - -
14 Warriors Lost 12 - 42 Centre 80 - 2 - - 4 - - 1 - 2 38 - 17 9 4 116 5 -
15 Raiders Won 16 - 34 Centre 80 1 5 - - 14 - - - - 4 50 - 22 11 2 151 - -
18 Sea Eagles Lost 20 - 21 Centre 84 - 3 - - 6 - - - - 3 46 1 18 11 6 132 - 5
20 Bulldogs Won 20 - 18 Centre 80 - 4 - - 8 - - - - 4 54 - 15 5 - 129 - -
21 Sharks Won 30 - 22 Centre 80 - 5 - - 10 12 - 1 1 4 33 - 21 15 3 127 - -
22 Wests Tigers Won 30 - 48 Centre 80 1 7 - - 18 - - 2 2 4 41 - 21 4 3 171 - -
23 Broncos Lost 18 - 42 Centre 80 - 3 - - 6 - - - - 4 52 - 22 10 5 171 17 15
24 Raiders Won 42 - 4 Centre 80 3 7 - - 26 - - - 1 2 50 1 24 10 1 176 - -
26 Storm Won 38 - 30 Centre 80 1 7 - - 18 - - 1 - 1 22 - 19 7 3 80 - -
27 Bulldogs Won 6 - 44 Centre 80 1 8 - - 20 14 - - - 4 36 - 19 8 2 128 - 6
28 Knights Won 28 - 16 Centre 80 - 4 - - 8 35 - 1 - 1 45 - 21 10 2 138 - -
29 Sharks Lost 26 - 18 Centre 77 2 2 - - 12 - - - 2 8 34 - 20 6 1 156 - -

Career By Season

Career By Season
Year Played Won Lost Drawn Win % Tries Goals 1 Point Field Goals 2 Point Field Goals Points Kicking Metres Kicking Metres Average Goal Conversion Rate Forced Drop Outs Try Assists Linebreaks Receipts Tackles Made Missed Tackles Tackle Efficiency Total Running Metres Average Running Metres Kick Return Metres Total Points Average Points
Sharks 2014 6 - 6 - - 3 - - - 12 - - - - 1 4 103 22 4 72.78% 721 120.00 169 131 21.8
Sharks 2015 25 15 10 - 60% 16 11 - - 89 272 10.88 84.62% 1 1 15 372 75 23 76.53% 3,054 122.00 1,013 729 29.2
Sharks 2016 26 19 6 1 73% 19 2 - - 80 151 5.79 28.57% - 2 21 382 94 20 75.42% 3,372 129.00 737 782 30.1
Sharks 2017 22 13 9 - 59% 6 10 - - 44 112 5.09 83.33% 2 5 10 528 71 31 69.61% 3,678 167.00 1,778 751 34.1
Sharks 2018 26 17 9 - 65% 22 28 - - 144 143 5.49 75.68% 2 8 26 696 94 39 70.68% 3,999 153.00 1,545 1,084 41.7
Cowboys 2020 12 4 8 - 33% 4 24 1 - 65 109 9.06 70.59% - 9 6 369 52 15 77.61% 1,457 121.00 541 445 37.1
Cowboys 2021 20 7 13 - 35% 4 54 2 - 126 134 6.72 72.97% 1 10 8 681 96 43 69.06% 3,476 173.00 1,306 839 42.0
Cowboys 2022 24 17 7 - 71% 10 100 2 1 244 57 2.38 81.97% - 5 12 478 169 50 77.17% 3,519 146.00 63 1,066 44.4
Cowboys 2023 18 10 8 - 56% 8 68 - 1 170 55 3.04 82.93% 1 6 11 357 140 39 78.21% 3,053 169.00 96 835 46.4
Cowboys 2024 24 14 10 - 58% 16 101 - - 266 157 6.55 84.87% 1 10 18 489 230 55 80.70% 3,657 152.00 44 1,175 49.0

Career Overall

Career Overall
Year Start Year End Played Won Lost Drawn Win % Tries Goals 1 Point Field Goals 2 Point Field Goals Points Kicking Metres Kicking Metres Average Goal Conversion Rate Forced Drop Outs Try Assists Linebreaks Receipts Tackles Made Missed Tackles Tackle Efficiency Total Running Metres Average Running Metres Kick Return Metres Total Points Average Points
Sharks 2014 2018 105 64 40 1 61% 66 51 - - 369 677 6.45 73.91% 5 17 76 2,081 356 117 75.26% 14,825 141.00 5,244 3,478 33.1
Cowboys 2020 2024 98 52 46 - 53% 42 347 5 2 871 512 5.22 80.51% 3 40 55 2,371 687 202 77.28% 15,147 154.00 2,045 4,357 44.5

Latest

Team Mates

Acknowledgement of Country

National Rugby League respects and honours the Traditional Custodians of the land and pay our respects to their Elders past, present and future. We acknowledge the stories, traditions and living cultures of Aboriginal and Torres Strait Islander peoples on the lands we meet, gather and play on.
Premier Partner

Media Partners

Major Partners

View All Partners