You have skipped the navigation, tab for page content
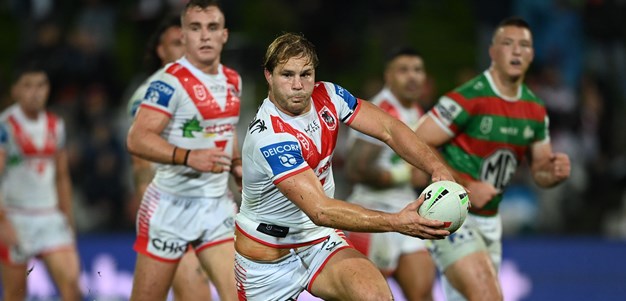
Jack de Belin Profile Image

Jack De Belin

Lock

Dragons

Player Bio

Height:
188 cm
Date of Birth:
17 March 1991
Weight:
106 kg
Birthplace:
Cootamundra, NSW
Age:
33
Nickname:
Bomber
Debut Club:
St. George Illawarra Dragons
Date:
27 June 2011
Opposition:
Manly-Warringah Sea Eagles
Round:
16
Previous Club:
-
Junior Club:
Cootamundra Bulldogs
Biography:

Dragon #156

Having debuted for the Dragons 14 years ago, de Belin moved into the top five on the club’s all-time games played list a year ago having surpassed the 200-game mark in 2023.

De Belin made his NRL debut for the Red V as a 20-year-old back in Round 16, 2011 – the same year he was named the Toyota Cup Player of the Year.

A Cootamundra Bulldogs product and Junior Kangaroo, he earnt Country Origin nods in 2016 and 2017 and a Blues call-up for their 2018 series win.

He made his international debut for Papua New Guinea at the end of 2023 helping lead them to victory in the inaugural Pacific Bowl Final.

The winner of the club’s Immortals Trophy in 2023, the 33-year-old will remain a Dragon until at least the end of the 2025 season having inked an extension.

Career

Appearances
229
Tries
18

2024 Season

Appearances
24

Scoring

Tries
3

Attack

Tackle Breaks
29
Average Hit Ups
11.2
Post Contact Metres
1025.9

Passing

Offloads
16

Defence

Tackles Made
743
Tackle Efficiency

Running Metres

Average Running Metres
130
Total Running Metres
3139

Fantasy

Total Points
1150
Average Points
47.9

2024 Season - By Round

Round Opponent Score Position Minutes Played Tries Goals 1 Point Field Goals 2 Point Field Goals Points Try Assists Linebreaks Tackle Breaks Post Contact Metres Offloads Receipts Tackles Made Missed Tackles Total Running Metres Hit Up Running Metres Kick Return Metres
1 Titans Won 4 - 28 Prop 57 - - - - - - - - 8 - 10 41 2 34 27 -
2 Dolphins Lost 38 - 0 Lock 51 - - - - - - - - 32 1 10 36 3 80 74 -
3 Cowboys Lost 24 - 46 Prop 61 - - - - - - - 1 29 2 17 40 3 111 73 -
4 Sea Eagles Won 20 - 12 Interchange 62 - - - - - - - 1 58 2 24 25 - 156 126 13
5 Knights Lost 30 - 10 Prop 53 - - - - - - - 1 34 1 18 42 1 108 83 -
6 Wests Tigers Won 12 - 24 Interchange 56 - - - - - - - 1 46 2 21 28 1 144 120 -
7 Warriors Won 30 - 12 Interchange 59 - - - - - - - 1 57 1 22 21 2 147 131 -
8 Roosters Lost 18 - 60 Interchange 58 1 - - - 4 - 1 5 28 1 23 34 2 113 80 -
9 Sharks Lost 20 - 10 Interchange 40 - - - - - - - - 39 1 22 31 - 127 106 -
10 Rabbitohs Won 28 - 14 Lock 60 1 - - - 4 - - - 67 - 27 22 - 200 176 -
12 Bulldogs Lost 44 - 12 Lock 69 - - - - - - - 5 59 - 17 41 1 159 159 -
13 Panthers Won 10 - 22 Prop 57 - - - - - - - - 56 2 25 28 1 176 136 9
14 Wests Tigers Won 56 - 14 Prop 41 - - - - - - 1 2 44 - 15 18 - 123 106 10
15 Sea Eagles Lost 30 - 14 Prop 45 - - - - - - - - 28 1 17 19 2 87 75 -
17 Dolphins Won 26 - 6 Prop 67 1 - - - 4 - 1 2 45 1 24 37 2 130 108 12
18 Roosters Lost 42 - 12 Prop 57 - - - - - - - - 9 - 9 37 2 35 25 -
19 Broncos Won 26 - 30 Prop 54 - - - - - - - 1 64 1 24 36 1 176 151 11
21 Panthers Lost 10 - 46 Prop 42 - - - - - - - 1 22 - 9 27 - 61 48 -
22 Storm Won 16 - 18 Interchange 47 - - - - - - - 3 38 - 25 23 2 160 99 32
23 Bulldogs Lost 10 - 28 Interchange 48 - - - - - - - 1 57 - 21 28 - 156 110 -
24 Titans Won 32 - 16 Interchange 55 - - - - - - - 1 74 - 19 28 1 167 108 40
25 Sharks Lost 10 - 38 Interchange 43 - - - - - - - 2 37 - 18 27 1 100 95 -
26 Eels Lost 44 - 40 Prop 67 - - - - - - - - 37 - 29 47 2 156 66 57
27 Raiders Lost 24 - 26 Prop 55 - - - - - - - 1 60 - 27 27 - 223 119 57

Career By Season

Career By Season
Year Played Won Lost Drawn Win % Tries Goals 1 Point Field Goals 2 Point Field Goals Points Kicking Metres Kicking Metres Average Tackle Breaks Post Contact Metres Offloads Tackles Made Missed Tackles Tackle Efficiency Total Running Metres Average Running Metres Kick Return Metres Total Points Average Points
Dragons 2011 3 1 2 - 33% - - - - - - - 6 - - 47 2 89.17% 132 44.00 - - -
Dragons 2012 19 9 10 - 47% - - - - - 42 2.21 14 - 10 422 15 96.57% 1,080 56.00 - - -
Dragons 2013 20 6 14 - 30% 1 - - - 4 - - 10 765 13 527 14 93.34% 1,972 98.00 199 740 37.0
Dragons 2014 22 11 11 - 50% 2 - - - 8 - - 20 754 7 578 16 94.68% 2,059 93.00 265 675 30.7
Dragons 2015 22 12 10 - 55% 1 - - - 4 - - 15 919 27 769 27 96.61% 2,705 122.00 341 1,056 48.0
Dragons 2016 21 8 13 - 38% 1 - - - 4 - - 30 626 15 917 16 95.33% 2,451 116.00 158 1,214 57.8
Dragons 2017 23 11 12 - 48% 2 - - - 8 - - 64 972 42 807 29 96.53% 3,372 146.00 107 1,339 58.2
Dragons 2018 25 16 9 - 64% 3 - - - 12 - - 55 896 30 810 40 95.29% 2,765 110.00 67 1,186 47.4
Dragons 2021 11 3 8 - 27% - - - - - - - 11 379 1 423 16 96.36% 1,202 109.00 23 538 48.9
Dragons 2022 24 12 12 - 50% 5 - - - 20 6 0.25 30 812 18 777 39 95.22% 2,382 99.00 20 1,141 47.5
Dragons 2023 16 3 13 - 19% 1 - - - 4 - - 20 441 11 691 27 96.24% 1,841 115.00 - 921 57.6
Dragons 2024 24 11 13 - 46% 3 - - - 12 - - 29 1,026 16 743 29 96.24% 3,139 130.00 245 1,150 47.9

Career Overall

Career Overall
Year Start Year End Played Won Lost Drawn Win % Tries Goals 1 Point Field Goals 2 Point Field Goals Points Kicking Metres Kicking Metres Average Tackle Breaks Post Contact Metres Offloads Tackles Made Missed Tackles Tackle Efficiency Total Running Metres Average Running Metres Kick Return Metres Total Points Average Points
Dragons 2011 2024 229 102 127 - 45% 18 - - - 72 48 0.21 300 7,560 189 7,479 267 96.55% 24,949 108.00 1,429 9,900 47.8

Latest

Team Mates

Acknowledgement of Country

National Rugby League respects and honours the Traditional Custodians of the land and pay our respects to their Elders past, present and future. We acknowledge the stories, traditions and living cultures of Aboriginal and Torres Strait Islander peoples on the lands we meet, gather and play on.
Premier Partner

Media Partners

Major Partners

View All Partners